Classes
This chapter documents the Classes used in this package.
Poker
Class object for running the package.
- Poker(repo_location, grouped, money_multi):
Calculate stats for all games and players.
- Parameters:
repo_location (str) – Location of data folder.
grouped (str) – List of lists, filled with unique player Ids that are related to the same person. Optional
money_multi (int) – Multiple to divide the money amounts to translate them to dollars Optional
- Example:
from poker.poker_class import Poker
repo = 'location of your previous game'
grouped = [['YEtsj6CMK4', 'M_ODMJ-3Je', 'DZy-22KNBS'],
            ['48QVRRsiae', 'u8_FUbXpAz']]
poker = Poker(repo_location=repo, grouped=grouped)
- Note:
Grouped will need to be figured out by the player. The grouped stats are only taken into account within this class
Poker Attributes:
Name |
Type |
Description |
|---|---|---|
Poker.files |
List[str] |
Returns list of data files |
Poker.matches |
dict |
Returns list of data files |
Poker.players_money_overview |
pd.DataFrame |
Returns summary info for each player across games |
Poker.card_distribution |
pd.DataFrame |
Returns count and percent for each card that showed up across games |
Poker.winning_hand_distribution |
pd.DataFrame |
Returns count and percent of each type of winning hand across games |
Poker.players_history |
dict |
Collects player stats for all matches and groups based on grouper input |
DocumentFilter
Class for getting data from Poker.
- The class_lst can have any of the following:
Requests
Approved
Joined
MyCards
SmallBlind
BigBlind
Folds
Calls
Raises
Checks
Wins
Shows
Quits
Flop
Turn
River
Undealt
StandsUp
SitsIn
PlayerStacks
- The position_lst can have any of the following:
‘Pre Flop’
‘Post Flop’
‘Post Turn’
‘Post River’
- The win_loss_all can be one of the following:
‘Win’
‘Loss’
‘All’
- The column_lst can have any of the following:
‘All In’
‘Bet Amount’
‘Class’
‘End Time’
‘From Person’
‘Game Id’
‘Player Current Chips’
‘Player Index’
‘Player Name’
‘Player Starting Chips’
‘Position’
‘Pot Size’
‘Previous Time’
‘Remaining Players’
‘Round’
‘Start Time’
‘Time’
‘Win’
‘Win Hand’
‘Win Stack’
‘Winner’
- DocumentFilter(data):
Get a selection from the Poker Object. Uses a set of filters to return a desired set of data to be used in later analysis.
- Parameters:
data (Poker) – Input Poker object to be filtered.
game_id_lst (Union[List[str], str, None]) – Game Id filter, default is None. Optional
player_index_lst (Union[List[str], str, None]) – Player Index filter, default is None. Optional
player_name_lst (Union[List[str], str, None]) – Player Name filter, default is None. Optional
class_lst (Union[List[str], str, None]) – Filter by class objects, default is None. Optional
position_lst (Union[List[str], str, None]) – Filter by position, default is None. Optional
win_loss_all (Union[str, None]) – Filter by Win, Loss or All, default is None. Optional
column_lst (Union[List[str], str, None]) – Filter by column name, default is None. Optional
- Example:
None
- Note:
All inputs, except data, are Optional and defaults are set to None. Any str inputs are placed in a list.
DocumentFilter Attributes:
Name |
Type |
Description |
|---|---|---|
DocumentFilter.df |
pd.DataFrame |
Returns a DataFrame of requested items |
DocumentFilter.game_id_lst |
Union[List[str], None] |
Returns game id input |
DocumentFilter.player_index_lst |
Union[List[str], None] |
Returns player index input |
DocumentFilter.player_name_lst |
Union[List[str], None] |
Returns player name input |
DocumentFilter.class_lst |
Union[List[str], None] |
Returns class input |
DocumentFilter.position_lst |
Union[List[str], None] |
Returns position input |
DocumentFilter.win_loss_all |
Union[List[str], None] |
Returns win loss or all input |
DocumentFilter.column_lst |
Union[List[str], None] |
Returns column input |
Game
Class object used for getting specific game stats.
- Game(hand_lst, file_id, players_data):
Calculate stats for a game.
- Parameters:
hand_lst (List[dict]) – List of dict’s from the csv.
file_id (str) – Name of file.
players_data (dict) – A dict of player data.
- Example:
None
- Note:
This class is intended to be used internally.
Game Attributes:
Name |
Type |
Description |
|---|---|---|
Game.file_name |
str |
Returns name of data file |
Game.hands_lst |
List[Hand] |
Returns list of hands in the game |
Game.card_distribution |
dict |
Returns count of each card that showed up |
Game.winning_hand_distribution |
dict |
Returns count of winning hands |
Game.players_data |
dict |
Returns Player stats for players across hands |
Game.game_stats |
dict |
Returns Mean stats for Game across hands |
Player
Class object used for getting specific player stats.
- Player(player_index):
Calculate stats for a player.
- Parameters:
player_index (str or List[str]) – A unique player ID.
- Example:
None
- Note:
This class is intended to be used internally.
Player Attributes:
Name |
Type |
Description |
|---|---|---|
Player.win_percent |
dict |
Returns player win percent |
Player.win_count |
dict |
Returns player win count |
Player.largest_win |
dict |
Returns players largest win |
Player.largest_loss |
dict |
Returns players largest loss |
Player.hand_count |
dict |
Returns total hand count when player involved |
Player.all_in |
dict |
Returns a dict documenting when the player went all in |
Player.player_index |
List[str] |
Returns player index or indexes |
Player.player_name |
List[str] |
Returns player name or names |
Player.player_money_info |
dict |
Returns a dict of DataFrames documenting player buy-in and loss counts |
Player.hand_dic |
dict |
Returns a dict of DataFrames documenting hands when the player won |
Player.card_dic |
dict |
Returns a dict of DataFrames documenting card appearances |
Player.line_dic |
dict |
Returns a dict with a list of objects where player involved |
Player.moves_dic |
dict |
Returns a players moves on the table |
Player.merged_moves |
dict |
Returns a combined dict of player moves |
Hand
Class object used for getting specific hand stats.
- Hand(lst_hand_objects, file_id, player_dic):
Organizes a hand with a class and adds the stands to the player_dic.
- Parameters:
lst_hand_objects (list) – A list of Class Objects connected to a hand.
file_id (str) – Unique file name.
player_dic (dict) – Dict of players.
- Example:
None
- Note:
This class is intended to be used internally.
Hand Attributes:
Name |
Type |
Description |
|---|---|---|
Hand.merged_moves |
list |
Returns a list of actions as objects |
Hand.small_blind |
SmallBlind |
Returns SmallBlind Class |
Hand.big_blind |
BigBlind |
Returns BigBlind Class |
Hand.winner |
Wins |
Returns Wins Class or list of Wins Classes |
Hand.starting_players |
dict |
Returns dict of name and ID for each player that was present at the hand start |
Hand.starting_players_chips |
dict |
Returns dict of name and stack amount for each player that was present at the hand start |
Hand.flop_cards |
Flop |
Returns Flop Class |
Hand.turn_card |
Turn |
Returns Turn Class |
Hand.river_card |
River |
Returns River Class |
Hand.my_cards |
MyCards |
Returns MyCards Class |
Hand.chips_on_board |
int |
Returns the count of chips on the table |
Hand.gini_coef |
float |
Returns the gini coef for the board |
Hand.pot_size_lst |
List[int] |
Returns pot size over course of hand |
Hand.players |
dict |
Returns dict of player moves |
Hand.start_time |
TimeStamp |
Returns time of first hand item |
Hand.end_time |
TimeStamp |
Returns time of last hand item |
Hand.win_stack |
Union[int, None] |
Returns win amount for the hand |
Hand.bet_lst |
List[int] |
Returns Raise amounts for the hand |
Processor
Class object for holding information from lines.
- The following child classes use this framework:
Requests
Approved
Joined
MyCards
SmallBlind
BigBlind
Folds
Calls
Raises
Checks
Wins
Shows
Quits
Flop
Turn
River
Undealt
StandsUp
SitsIn
PlayerStacks
- LineAttributes:
Applies attributes to a respective Class object.
- Parameters:
text (str) – A line of text from the data.
- Example:
None
- Note:
This class is intended to be used internally. All values are set to None or 0 by default.
LineAttributes Attributes:
Name |
Type |
Description |
|---|---|---|
LineAttributes.text |
Union[str, None] |
Text input |
LineAttributes.player_name |
Union[str, None] |
Player Name |
LineAttributes.player_index |
Union[str, None] |
Player Id |
LineAttributes.stack |
Union[int, None] |
Amount offered to the table |
LineAttributes.position |
Union[str, None] |
Position of move in relation to table cards being drawn |
LineAttributes.winning_hand |
Union[str, None] |
Winning hand |
LineAttributes.cards |
Union[str, list, None] |
Card or cards |
LineAttributes.current_round |
Union[int, None] |
Round number within the game |
LineAttributes.pot_size |
Union[int, None] |
Size of pot when move happens |
LineAttributes.remaining_players |
Union[List[str], None] |
Players left in hand |
LineAttributes.action_from_player |
Union[str, None] |
Who bet previously |
LineAttributes.action_amount |
Union[int, None] |
Previous bet amount |
LineAttributes.all_in |
Union[bool, None] |
Notes if player when all-in |
LineAttributes.game_id |
Union[str, None] |
File name |
LineAttributes.starting_chips |
Union[int, None] |
Player’s chip count at start of hand |
LineAttributes.current_chips |
Union[int, None] |
Player’s chip count at time of move |
LineAttributes.winner |
Union[str, None] |
Player Name who wins the hand |
LineAttributes.win_stack |
Union[int, None] |
Amount won at end of hand |
LineAttributes.time |
TimeStamp |
Timestamp of action |
LineAttributes.previous_time |
TimeStamp |
Timestamp of previous action |
LineAttributes.start_time |
TimeStamp |
Timestamp of the start of the hand |
LineAttributes.end_time |
TimeStamp |
Timestamp of the end of the hand |
TSanalysis
Class for Time Series Analysis. The ts_analysis function in Analysis does not compute running values.
- TSanalysis:
Calculate Time Series stats for a player.
- Parameters:
data (DocumentFilter) – Input DocumentFilter.
upper_q (float) – Upper Quantile percent, default is 0.841. Optional
lower_q (float) – Lower Quantile percent, default is 0.159. Optional
window (int) – Rolling window, default is 5. Optional
- Example:
>>> from poker.time_series_class import TSanalysis
>>> docu_filter = DocumentFilter(data=poker, player_index_lst=['DZy-22KNBS'])
>>> TSanalysis(data=docu_filter)
- Note:
This class expects a DocumentFilter with only one player_index used.
TSanalysis Attributes:
Name |
Type |
Description |
|---|---|---|
TSanalysis.ts_hand |
pd.DataFrame |
Hand Related base data |
TSanalysis.ts_hand_mean |
pd.DataFrame |
Hand Related mean data |
TSanalysis.ts_hand_std |
pd.DataFrame |
Hand Related std data |
TSanalysis.ts_hand_median |
pd.DataFrame |
Hand Related median data |
TSanalysis.ts_hand_upper_quantile |
pd.DataFrame |
Hand Related upper quantile data |
TSanalysis.ts_hand_lower_quantile |
pd.DataFrame |
Hand Related lower quantile data |
TSanalysis.ts_position |
pd.DataFrame |
Position Related base data |
TSanalysis.ts_position_mean |
pd.DataFrame |
Position Related mean data |
TSanalysis.ts_position_std |
pd.DataFrame |
Position Related std data |
TSanalysis.ts_position_median |
pd.DataFrame |
Position Related median data |
TSanalysis.ts_position_upper_quantile |
pd.DataFrame |
Position Related upper quantile data |
TSanalysis.ts_position_lower_quantile |
pd.DataFrame |
Position Related lower quantile data |
TSanalysis.ts_class |
pd.DataFrame |
Class Related base data |
TSanalysis.ts_class_mean |
pd.DataFrame |
Class Related mean data |
TSanalysis.ts_class_std |
pd.DataFrame |
Class Related std data |
TSanalysis.ts_class_median |
pd.DataFrame |
Class Related median data |
TSanalysis.ts_class_upper_quantile |
pd.DataFrame |
Class Related upper quantile data |
TSanalysis.ts_class_lower_quantile |
pd.DataFrame |
Class Related lower quantile data |
Plot Classes
Plot Class objects.
- Possible Font Size Strings:
‘xx-small’
‘x-small’
‘small’
‘medium’
‘large’
‘x-large’
‘xx-large’
- Possible Legend Locations:
‘best’
‘upper right’
‘upper left’
‘lower left’
‘lower right’
‘right’
‘center left’
‘center right’
‘lower center’
‘upper center’
‘center
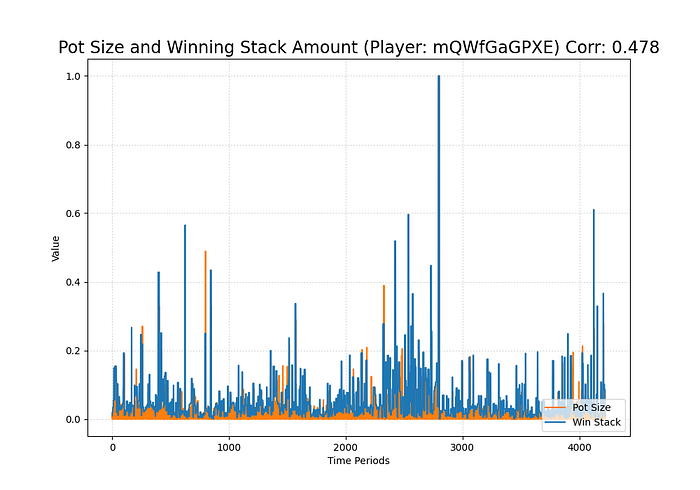
Line
- Line(data):
Class for Line plots.
- Parameters:
data (pd.DataFrame) – Input data.
limit (int) – Limit the length of data. Optional
label_lst (List[str]) – List of labels to include, if None will include all columns. Optional
color_lst (List[str]) – List of colors to graph, needs to be same length as label_lst. Optional
normalize_x (List[str]) – List of columns to normalize. Optional
running_mean_x (List[str]) – List of columns to calculate running mean. Optional
running_mean_value (int) – Value used when calculating running mean, default = 50. Optional
cumulative_mean_x (List[str]) – List of columns to calculate cumulative mean. Optional
fig_size (tuple) – Figure size, default = (10, 7). Optional
ylabel (str) – Y axis label. Optional
ylabel_color (str) – Y axis label color, default = ‘black’. Optional
ylabel_size (str) – Y label size, default = ‘medium’. Optional
xlabel (str) – X axis label. Optional
xlabel_color (str) – X axis label color, default = ‘black’. Optional
xlabel_size (str) – X label size, default = ‘medium’. Optional
title (str) – Graph title, default = ‘Line Plot’. Optional
title_size (str) – Title size, default = ‘xx-large’. Optional
grid (bool) – If True will show grid, default = true. Optional
grid_alpha (float) – Grid alpha, default = 0.75. Optional
grid_dash_sequence (tuple) – Grid dash sequence, default = (3, 3). Optional
grid_lineweight (float) – Grid lineweight, default = 0.5. Optional
legend_fontsize (str) – Legend fontsize, default = ‘medium’. Optional
legend_transparency (float) – Legend transparency, default = 0.75. Optional
legend_location (str) – legend location, default = ‘lower right’. Optional
corr (List[str]) – Pass two strings to return the correlation. Optional
- Example:
from poker.plot import Line
Line(data=val[['Pot Size', 'Win Stack']],
     normalize_x=['Pot Size', 'Win Stack'],
     color_lst=['tab:orange', 'tab:blue'],
     title='Pot Size and Winning Stack Amount (Player: ' + key + ')',
     ylabel='Value',
     xlabel='Time Periods',
     corr=['Pot Size', 'Win Stack'])
plt.show()
- Note:
None
Line Attributes:
Name |
Type |
Description |
|---|---|---|
Line.ax |
plt |
Returns a Line Plot |
Scatter
- Scatter(data):
Class for Scatter plots.
- Parameters:
data (pd.DataFrame,) – Input data.
limit (int) – Limit the length of data. Optional
label_lst (List[str]) – List of labels to include, if None will include all columns. Optional
color_lst (List[str]) – List of colors to graph. Optional
normalize_x (List[str]) – List of columns to normalize. Optional
regression_line (List[str]) – If included, requires a column str or List[str], default = None. Optional
regression_line_color (str) – Color of regression line, default = ‘red’. Optional
regression_line_lineweight (float) – Regression lineweight, default = 2.0. Optional
running_mean_x (List[str]) – List of columns to calculate running mean. Optional
running_mean_value (Optional[int] = 50,) – List of columns to calculate running mean. Optional
cumulative_mean_x (List[str]) – List of columns to calculate cumulative mean. Optional
fig_size (tuple) – default = (10, 7), Optional
ylabel (str) – Y axis label. Optional
ylabel_color (str) – Y axis label color, default = ‘black’. Optional
ylabel_size (str) – Y label size, default = ‘medium’. Optional
xlabel (str) – X axis label. Optional
xlabel_color (str) – X axis label color, default = ‘black’. Optional
xlabel_size (str) – X label size, default = ‘medium’. Optional
title (str) – Graph title, default = ‘Scatter Plot’. Optional
title_size (str) – Title size, default = ‘xx-large’. Optional
grid (bool) – If True will show grid, default = true. Optional
grid_alpha (float) – Grid alpha, default = 0.75. Optional
grid_dash_sequence (tuple) – Grid dash sequence, default = (3, 3). Optional
grid_lineweight (float) – Grid lineweight, default = 0.5. Optional
legend_fontsize (str) – Legend fontsize, default = ‘medium’. Optional
legend_transparency (float) – Legend transparency, default = 0.75. Optional
legend_location (str) – legend location, default = ‘lower right’. Optional
compare_two (List[str]) – If given will return a scatter comparing two variables, default is None. Optional
y_limit (float) – If given will limit the y axis, default is None. Optional
- Example:
from poker.plot import Scatter
Scatter(data=val,
        compare_two=['Round Seconds', 'Player Reserve'],
        normalize_x=['Round Seconds', 'Player Reserve'],
        color_lst=['tab:orange'],
        regression_line=['Player Reserve'],
        regression_line_color='tab:blue',
        title='Time per Hand vs Player Reserve (Player: ' + key + ')',
        ylabel='Player Chip Count',
        xlabel='Total Round Seconds')
plt.show()
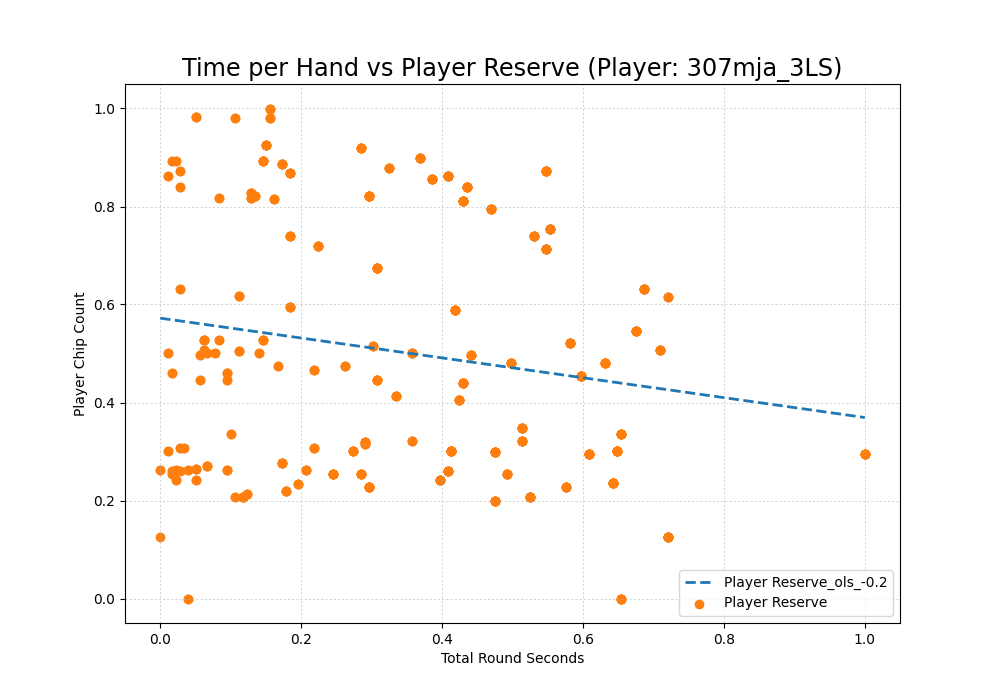
- Note:
Slope of the regression line is noted in he legend.
Scatter Attributes:
Name |
Type |
Description |
|---|---|---|
Scatter.ax |
plt |
Returns a Scatter Plot |
Histogram
- Histogram(data):
Class for Histogram plots.
- Parameters:
data (pd.DataFrame,) – Input data.
limit (int) – Limit the length of data. Optional
label_lst (List[str]) – List of labels to include, if None will include all columns. Optional
color_lst (List[str]) – List of colors to graph. Optional
include_norm (str) – Include norm. If included, requires a column str, default = None. Optional
norm_color (str) – Norm color, default = ‘red’. Optional
norm_lineweight (float) – Norm lineweight, default = 1.0. Optional
norm_ylabel (str) – Norm Y axis label. Optional
norm_legend_location (str) – Location of norm legend, default = ‘upper right’. Optional
fig_size (tuple) – default = (10, 7), Optional
bins (str) – Way of calculating bins, default = ‘sturges’. Optional
hist_type (str) – Type of histogram, default = ‘bar’. Optional
stacked (bool) – If True, will stack histograms, default = False. Optional
ylabel (str) – Y axis label. Optional
ylabel_color (str) – Y axis label color, default = ‘black’. Optional
ylabel_size (str) – Y label size, default = ‘medium’. Optional
ytick_rotation (Optional[int] = 0,) –
xlabel (str) – X axis label. Optional
xlabel_color (str) – X axis label color, default = ‘black’. Optional
xlabel_size (str) – X label size, default = ‘medium’. Optional
xtick_rotation (Optional[int] = 0,) –
title (str) – Graph title, default = ‘Histogram’. Optional
title_size (str) – Title size, default = ‘xx-large’. Optional
grid (bool) – If True will show grid, default = true. Optional
grid_alpha (float) – Grid alpha, default = 0.75. Optional
grid_dash_sequence (tuple) – Grid dash sequence, default = (3, 3). Optional
grid_lineweight (float) – Grid lineweight, default = 0.5. Optional
legend_fontsize (str) – Legend fontsize, default = ‘medium’. Optional
legend_transparency (float) – Legend transparency, default = 0.75. Optional
legend_location (str) – legend location, default = ‘lower right’. Optional
- Example:
from poker.plot import Histogram
Histogram(data=val,
          label_lst=['Move Seconds'],
          include_norm='Move Seconds',
          title='Move Second Histogram (Player: ' + key + ')')
plt.show()
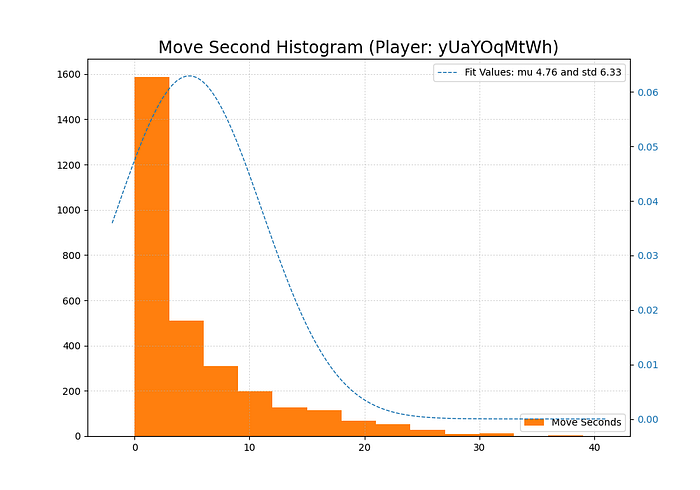
- Note:
None
Histogram Attributes:
Name |
Type |
Description |
|---|---|---|
Histogram.ax |
plt |
Returns a Histogram Plot |